

AI is changing the world order. Now is our time to shape it.

Register for the AI Leadership Summit in Sydney | 27 October

Australia's entrepreneurial base is shrinking. Since 2000, the share of the working-age population running their own business with employees has been in structural decline. Most strikingly, the fall has been sharpest among those best financially equipped to start one.

Entrepreneurship is an essential ingredient in Australia’s business dynamism, economic growth and productivity. New and young businesses are strongly associated with an innovative and resilient economy.1

Using data collected every four years on the financial conditions of respondents from the Household Income and Labour Dynamics in Australia (HILDA) Survey, we find Australia’s decline in entrepreneurship has been greatest among individuals in the wealthiest 20 per cent of households. Between 2002 and 2022 (the latest available data), the share of working-age individuals in that quintile who are business owners with employees fell from 13.8 per cent to 9.8 per cent.

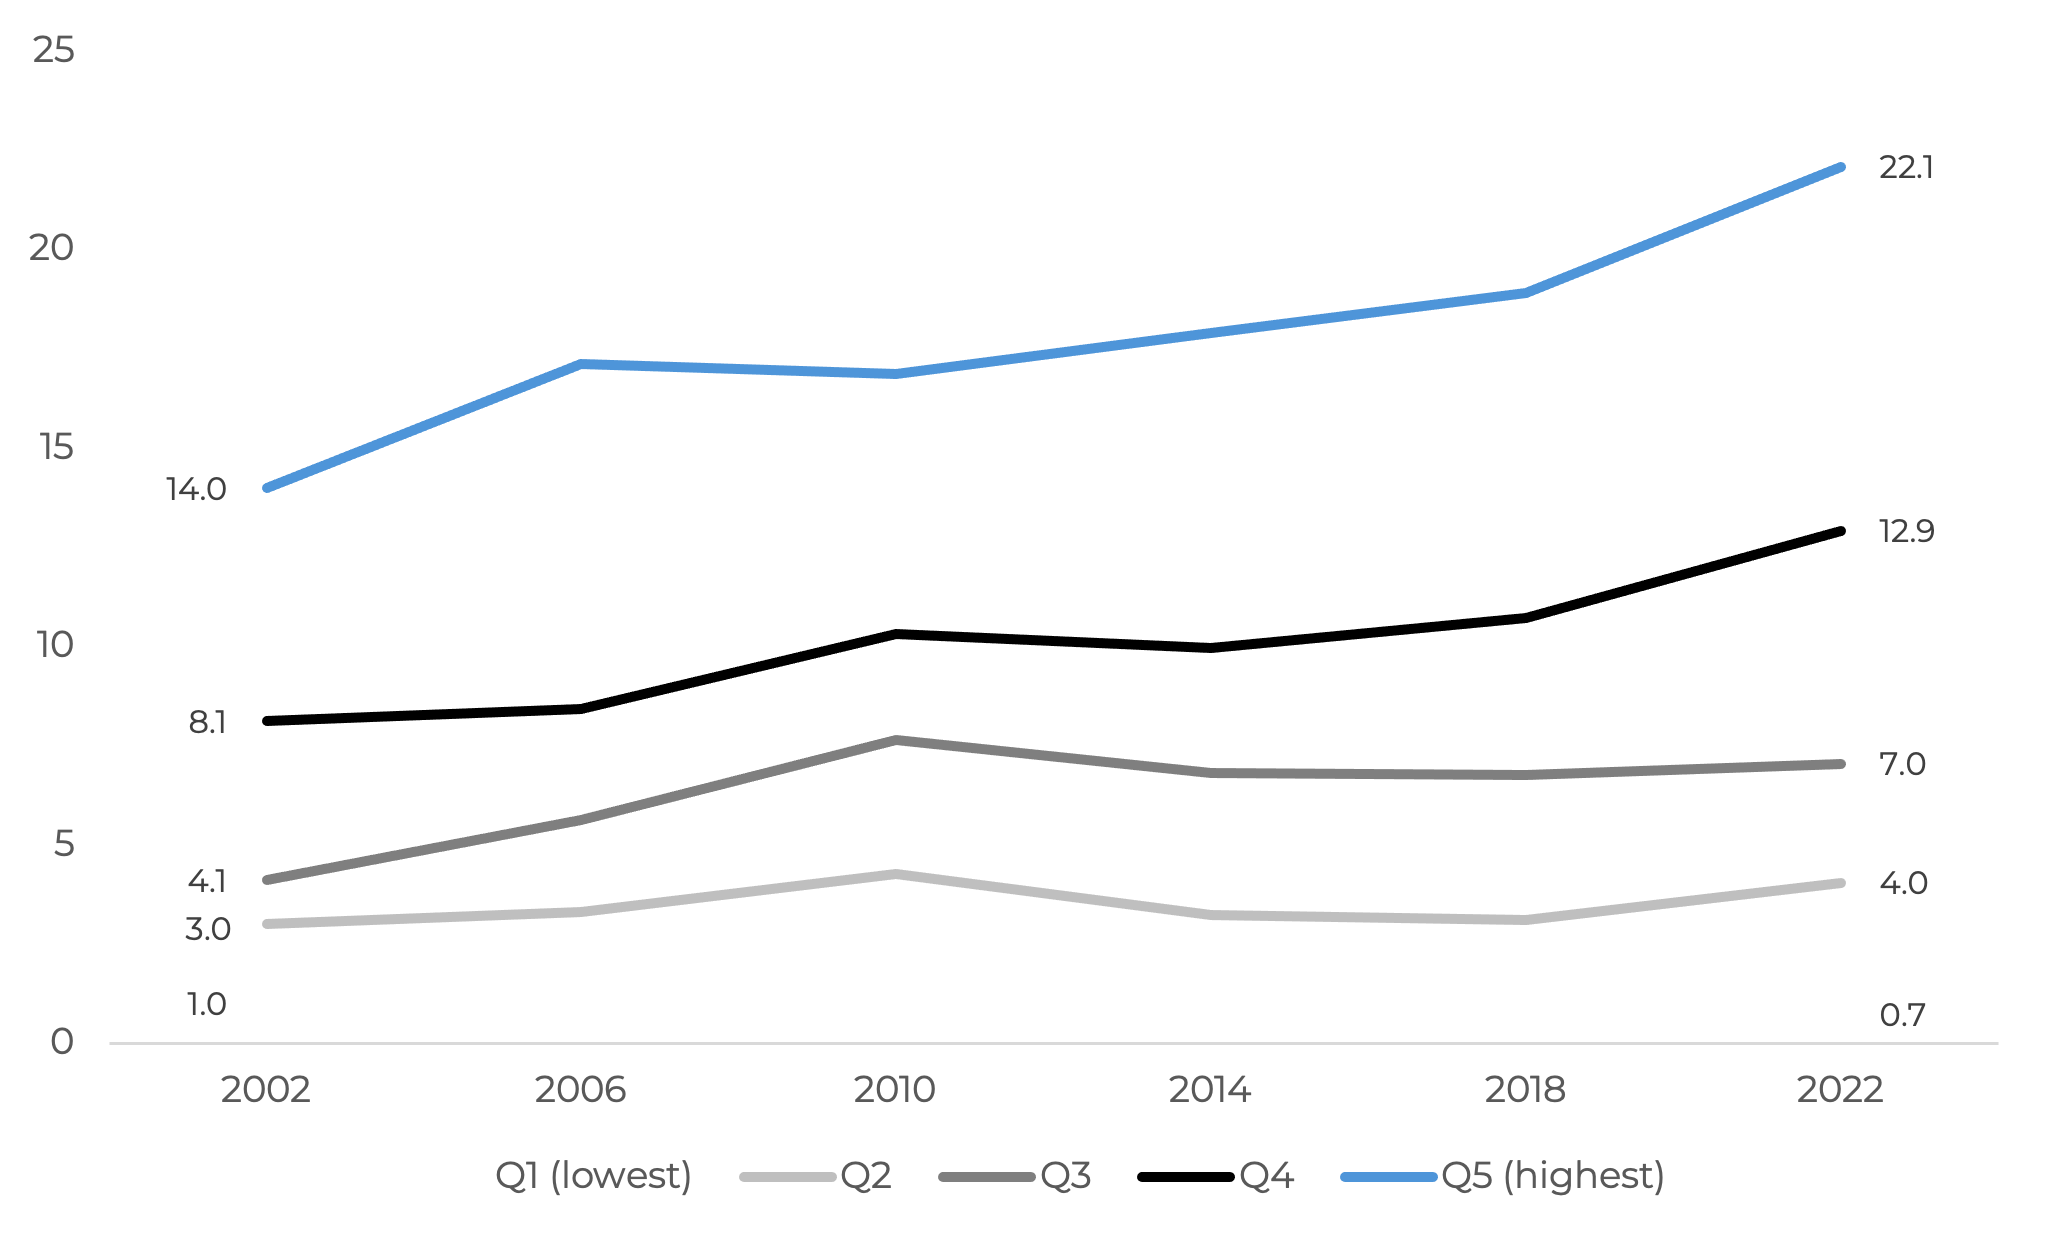
This decline has coincided with a rise in property investment. Among the same top wealth quintile, the share of working-age individuals with at least one investment property grew by 8.1 percentage points between 2002 and 2022.
The Australians best financially placed to start a business are doing so less, while investing more in property.

Similar trends are evident in the value of assets held by households. Over the past two decades, the wealthiest Australians have seen the proportion of their wealth tied to business assets fall, while the portion tied to investment properties has risen.

The drivers of declining entrepreneurship are complex and layered, but addressing distortions that favour property investment over businesses can help correct this trend.

Here, the 2026-27 federal budget makes progress, paring back long-standing advantages enjoyed by property investment while increasing concessions for small and young businesses. The commitment to cut the regulatory burden matters too, but the cuts must target the specific barriers to business entry and growth and be supported by action at all levels of government.

Entrepreneurship has declined the most among the wealthiest households

Entrepreneurs are a small but important cohort in Australia's business community. Those who choose to challenge the business status quo, push the technology frontier or deliver new products to market play an outsized role in business dynamism and economic growth.2

As documented in our previous report, Hustling, not Hiring, Australia has experienced a structural decline in business formation and self-employment since 2000.3

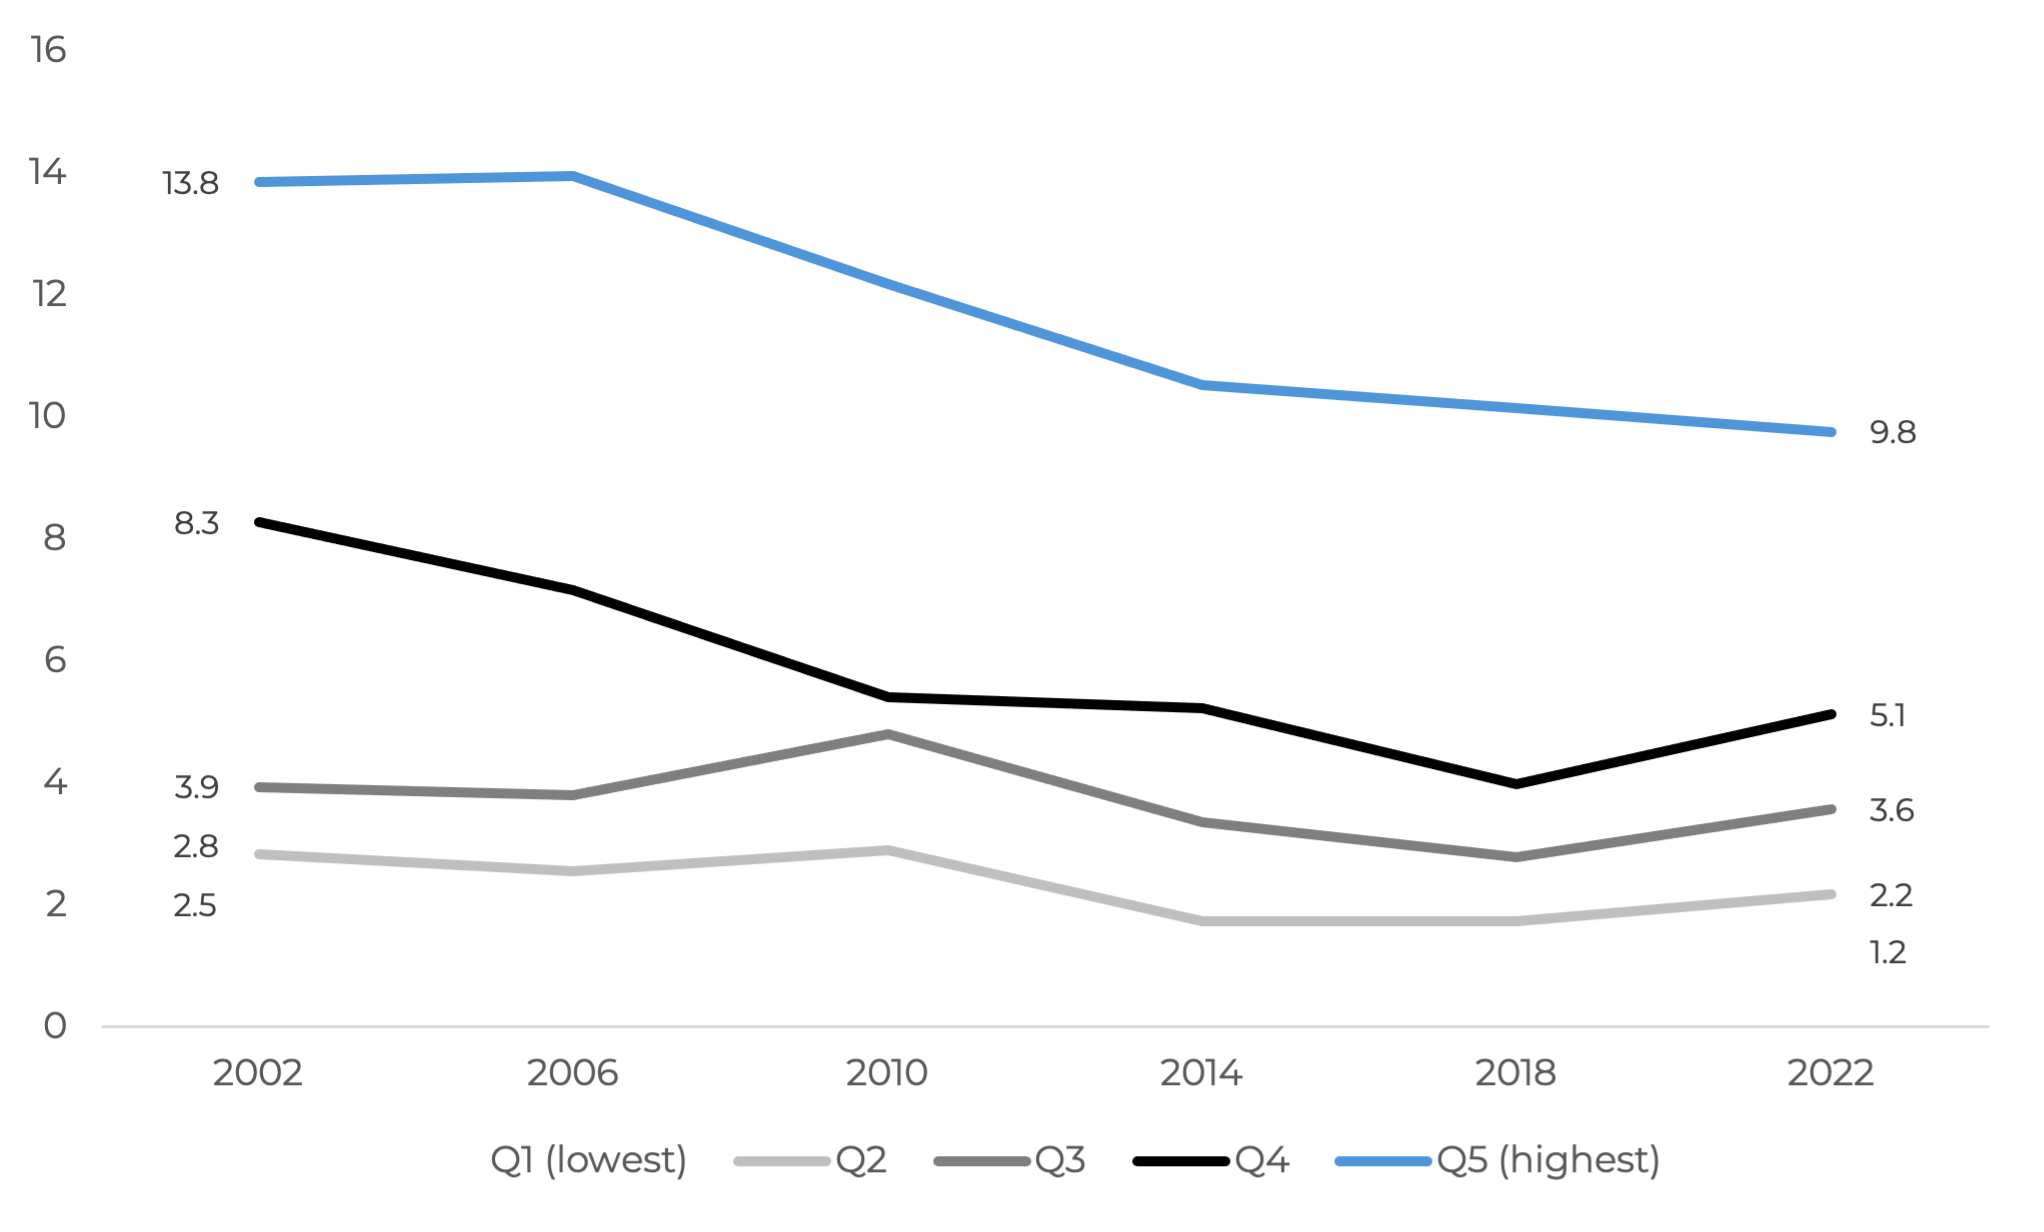
HILDA Survey data shows the decline is broad-based across the wealth distribution, but sharpest at the top. Among working-age individuals in the wealthiest 20 per cent of households, the share operating a business with employees has declined from 13.8 per cent in 2002 to 9.8 per cent in 2022 (figure 1).

The decline in entrepreneurship has coincided with a rise in property investment rates. In 2022, 22.1 per cent of working-age individuals in the wealthiest quintile of households owned an investment property, up from 14.0 per cent two decades earlier (figure 2).


Figure 1: The sharpest decline in entrepreneurship has been among the wealthiest

Share of working-age population who are self-employed business operators with employees, by household wealth quintile (%)

Source: HILDA Survey, Release 24


Figure 2: Investment properties have become more common among wealthy Australians

Share of working-age population who report rental income from an investment property, by household wealth quintile (%)

Note: A person is considered to own an investment property if they report rental income from it in that year, consistent with Singh et al. (2025)4
Source: HILDA Survey, Release 24

Household wealth is increasingly tied to property, not business

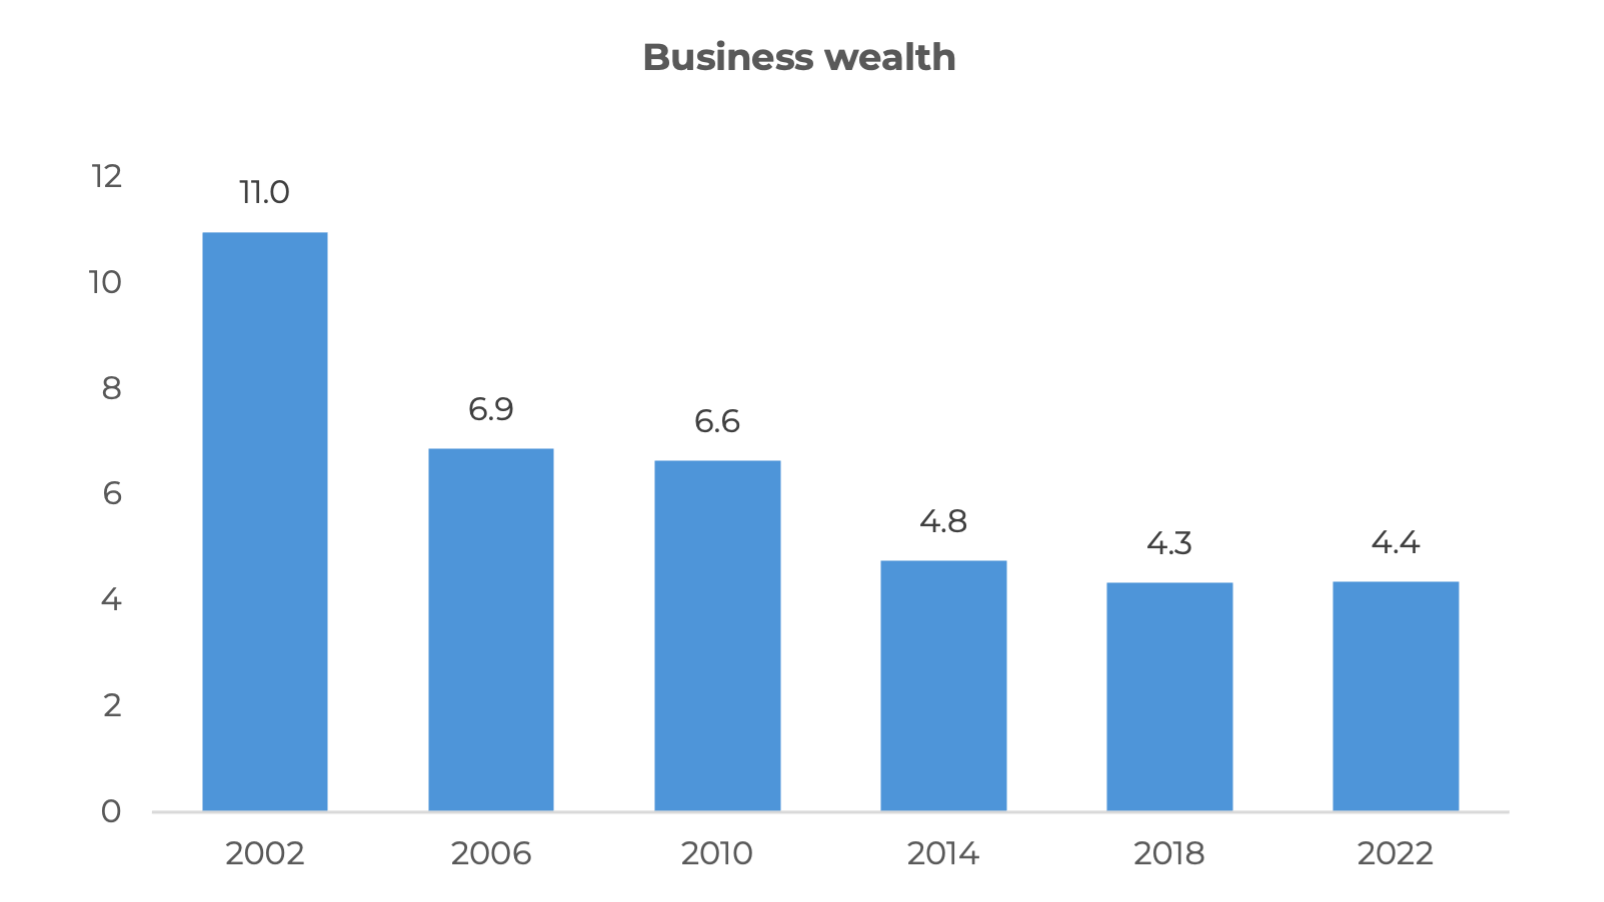
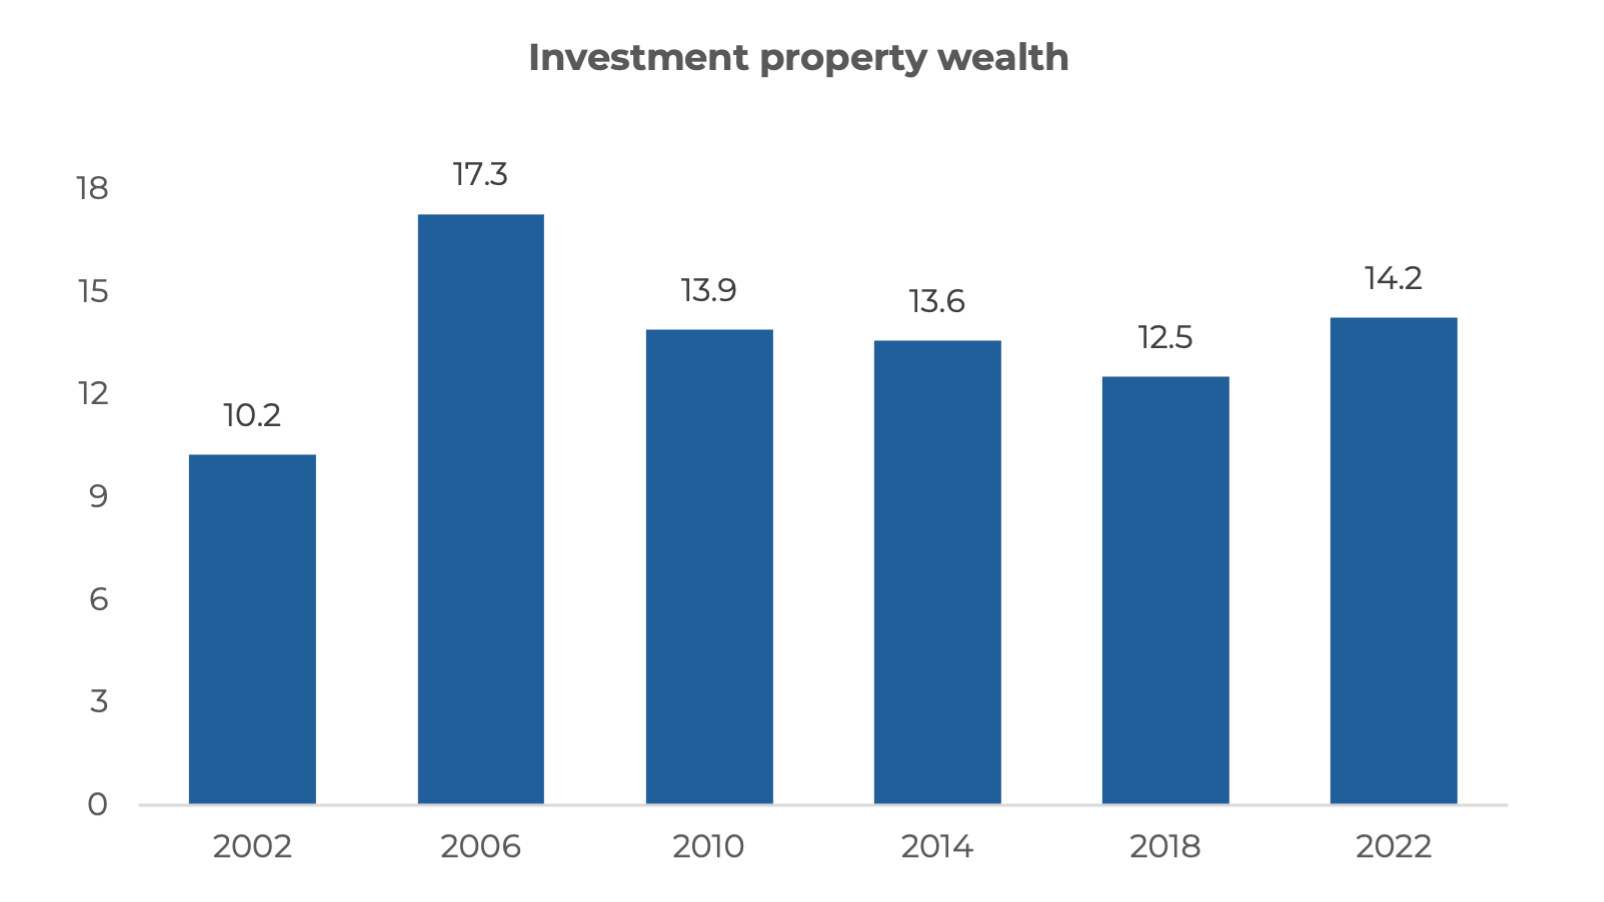
This is also borne out in where wealth sits. Among the wealthiest 20 per cent of households, wealth tied to the ownership of businesses has fallen from 11.0 per cent of total wealth in 2002 to just 4.4 per cent in 2022. Over the same period, the share tied to property, excluding the family home, has grown from 10.2 per cent to 14.2 per cent (figure 3).


Figure 3: Among the wealthiest households, business wealth has fallen and investment property wealth has risen

Proportion of total household wealth among the top quintile by asset class (%)

Note: The share of household wealth attributed to business or investment property is calculated as the difference between assets and debts for each asset class as a percentage of total wealth. Investment property assets are defined as property assets excluding the primary place of residence. 

Source: HILDA Survey, Release 24


While part of the increase in property wealth can be attributed to rising property prices, these trends suggest those who traditionally started a business, and are best financially equipped to do so, are instead seeing more of their wealth concentrated in the property market.

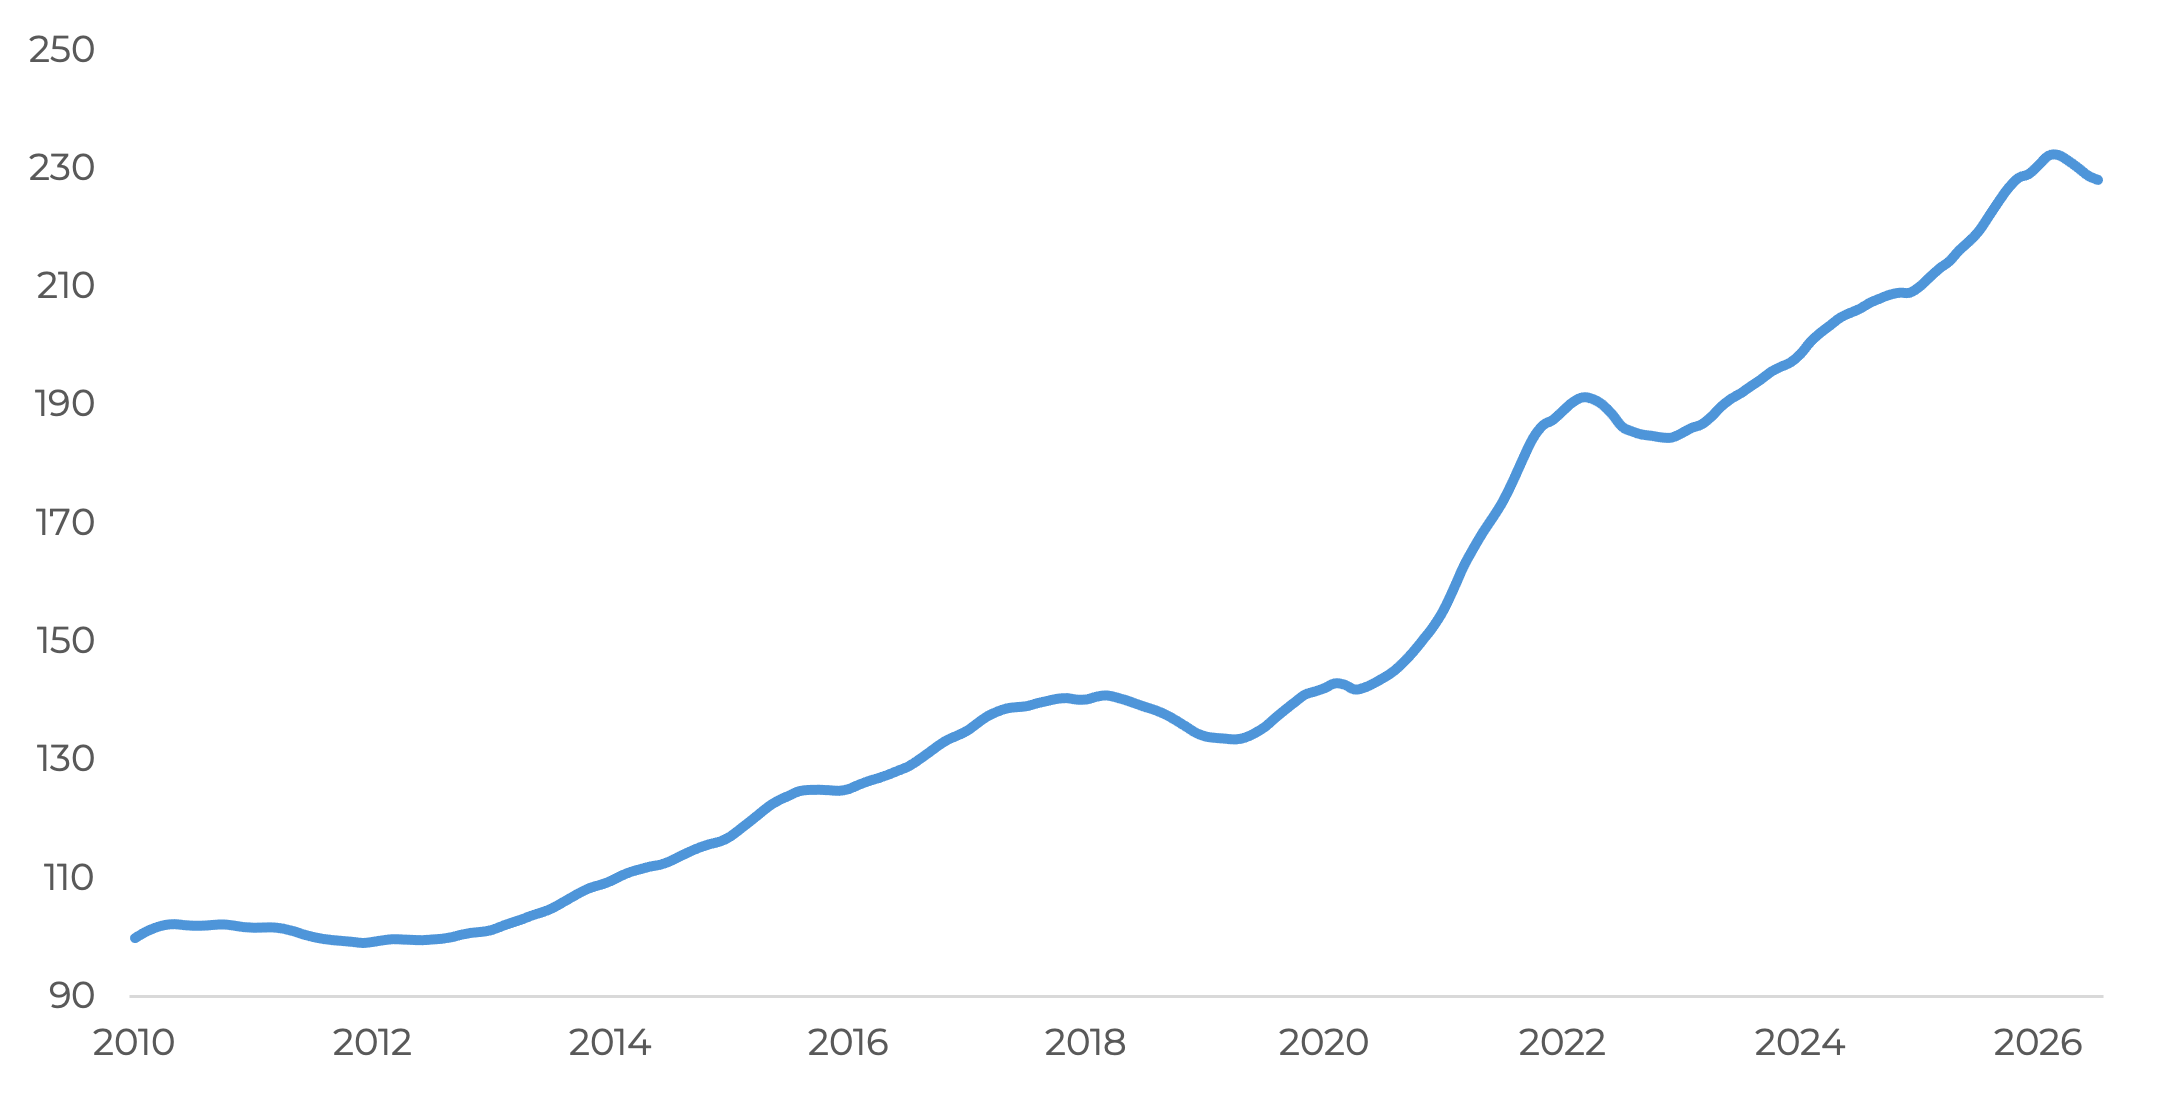
This has led some to raise concerns about the broader impacts of the recent slowing in house prices. These concerns are overstated. Even considering recent falls in values, house prices nationally are still up by more than double compared to 2010 (figure 4).

Figure 4: The recent downturn in prices is minor compared to value appreciation over recent decades

National average dwelling price, Jan 2010 = 100

Source: REA PropTrack

A policy system that favours property investment over businesses


These trends reflect policy settings that have steered capital towards property and away from entrepreneurship.

The 1999 capital gains discount rewards capital growth over rental or business income and has systematically overcompensated detached housing for inflation.5 Negative gearing compounds the effect, with losses deducted against gains taxed at a discount.6 

These settings have made property an attractive place to invest, without necessarily adding to supply. Less than 20 per cent of loans to property investors are used to expand housing supply, with the rest flowing into existing dwellings.7

Business investment has enjoyed no such tailwinds.

The small business capital gains concessions have remained gated by a $2 million turnover threshold and a $6 million net asset test, unchanged since 2007 even as consumer prices have risen roughly 64 per cent.8 

The growing regulatory burden adds to this problem, raising the cost of doing business and discouraging entry and growth. As an example, opening a café in Brisbane means working through a council checklist with up to 31 steps ‘before you can sell a single flat white’.9

Taken together, these policies reward passive investment in existing property over the productive risk-taking that drives new businesses, jobs and dynamism.


Adjusting incentives to encourage entrepreneurship


Investment incentives are not the only reason people start businesses, but they do matter. The current system has nudged household wealth towards property investment and away from business. That needs to change if we want to deliver more affordable housing and a more dynamic economy.

In this regard, the 2026-27 federal budget makes meaningful progress. Removing negative gearing on existing property and modifying the capital gains discount will rebalance some of the preferential treatment property has long enjoyed.

Other new policies should improve conditions for those starting a business. The permanent $20,000 instant asset write-off, a new loss refundability measure for early-stage start-ups and the raising of the small business concession threshold should incentivise business investment.


These initiatives alone will not be sufficient to invigorate Australia’s business dynamism. Feedback from businesses engaged with CEDA and a growing body of research consistently highlight the role regulation currently plays in stifling economic activity.10 This must be addressed.

Regulation that cannot demonstrate a clear link to improved outcomes should be heavily scrutinised and revisited. Governments also need to focus on the cumulative effect that individual, often well-meaning regulation can have on productivity and dynamism. The commitment from the federal government to reduce the regulatory burden by $10.2 billion is a good start but needs to be followed up by action and discipline.11

Altogether these measures will begin the process of correcting a system that for too long has favoured bricks over businesses.

Author

Daniel Beadle

Economist

Daniel Beadle

Economist


This paper uses unit record data from Household, Income and Labour Dynamics in Australia (HILDA) Survey conducted by the Australian Government Department of Social Services (DSS). The findings and views reported in this paper, however, are those of the author[s] and should not be attributed to the Australian Government, DSS, or any of DSS’ contractors or partners. DOI: https://doi.org/10.26193/6M1BMR

1. e61 Institute. (2025). The young and the restless: The contribution of young firms to the economy (Micro Note No. 28). https://e61.in/wp-content/uploads/2025/09/The_young_and_the_restless.pdf

2. e61 Institute. (2025). The young and the restless: The contribution of young firms to the economy (Micro Note No. 28). https://e61.in/wp-content/uploads/2025/09/The_young_and_the_restless.pdf

3. Committee for Economic Development of Australia. (2026). Hustling not Hiring: Why Fewer Australians are Starting a Business. https://www.ceda.com.au/research-and-policy/research/economy/hustling-not-hiring-why-fewer-australians-are-starting-a-business

4. Singh, R., Ong ViforJ, R., Leishman, C., & Hewton, J. (2025). Modelling landlord behaviour and its impact on rental affordability: Insights across two decades (AHURI Final Report No. 440). Australian Housing and Urban Research Institute. https://doi.org/10.18408/ahuri8129501

5. Wilkinson, J. (2026). Address to the Australian Business Economists [Speech transcript]. Australian Government Treasury. https://treasury.gov.au/speech/address-australian-business-economists-2026

6. Commonwealth of Australia. (2026). Budget Strategy and Outlook: Budget Paper No. 1, 2026–27. https://budget.gov.au/content/bp1/download/bp1_bs-4.pdf.

7. Australian Bureau of Statistics. (2026). Lending indicators. https://www.abs.gov.au/statistics/economy/finance/lending-indicators/latest-release

8. Australian Bureau of Statistics. (2025). Consumer Price Index, Australia. https://www.abs.gov.au/statistics/economy/price-indexes-and-inflation/consumer-price-index-australia/latest-release#data-downloads

9. Productivity Commission. (2025). Creating a More Dynamic and Resilient Economy. https://www.pc.gov.au/inquiries-and-research/resilient-economy/report

10. Committee for Economic Development Australia. (2025). Tracking the Rise of Industry Regulation. https://www.ceda.com.au/research-and-policy/research/government-regulation/tracking-the-rise-of-industry-regulation.

11. Committee for Economic Development of Australia. (2026). Hustling not Hiring: Why Fewer Australians are Starting a Business. https://www.ceda.com.au/research-and-policy/research/economy/hustling-not-hiring-why-fewer-australians-are-starting-a-business